
outliers
Preseason ratings and projections are just a (decent) starting point.
One of the distinguishing characteristics of my approach to FEI preseason projections is that I only use prior team and unit performance data to produce them. FEI, OFEI, DFEI, and SFEI ratings from each of the previous five seasons, weighted for more recent results, are the only inputs in my projection formula.
This might seem ridiculous, especially in our current era of significant roster changes from year to year. We don’t really know anything yet about how new players, coaches, and schemes might mesh together and impact the upcoming season. What projection value could possibly be gleaned from the results of games from several years ago — or even from last season for that matter — with so much annual turnover chaos dominating the sport? And yet…
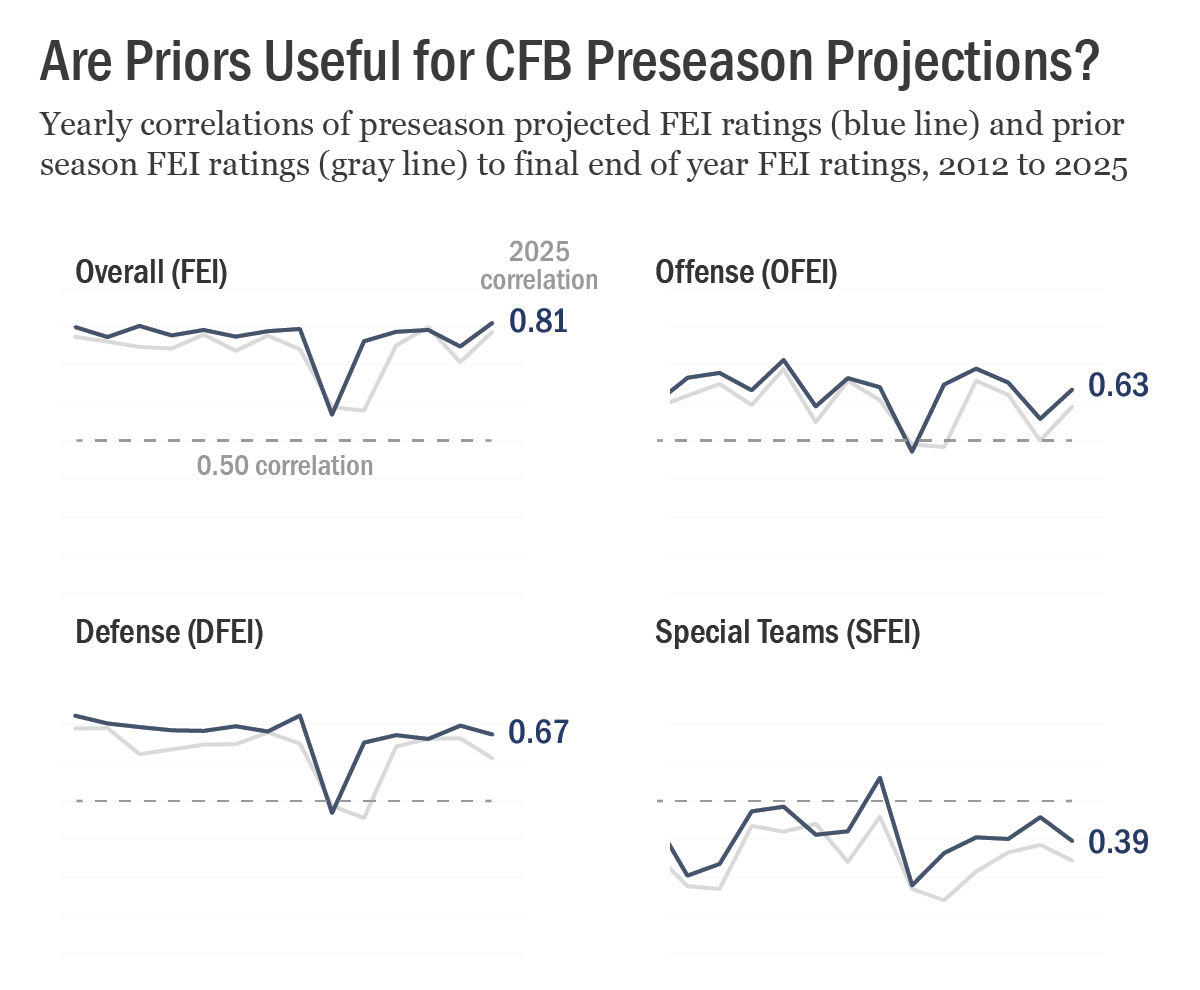
… prior season team and unit ratings remain about as useful as they’ve ever been! Imperfect, of course — the college football season wouldn’t be as much fun to watch if we were certain of how every result will play out. I use FEI preseason data to project game outcomes and calculate win total distributions, but I like to think about their utility primarily as a reasonably good baseline for setting program expectations. Team X has been this good or bad recently and this is how they’ve been trending; now let’s see if and how that trajectory changes this season.
As always, I will continue to reduce the weight of preseason projections gradually over the course of the season in my weekly FEI ratings updates so that by the end, only current season results are included. This is also why I find the charts above and their underlying data so interesting. Preseason FEI ratings are based on five years of priors and end of year FEI ratings don’t include any of that prior season data, and there is still a fairly strong correlation between these independent data points. What’s in the DNA of so many programs that keeps year over year performance relatively stable in spite of apparently dramatic transition factors?
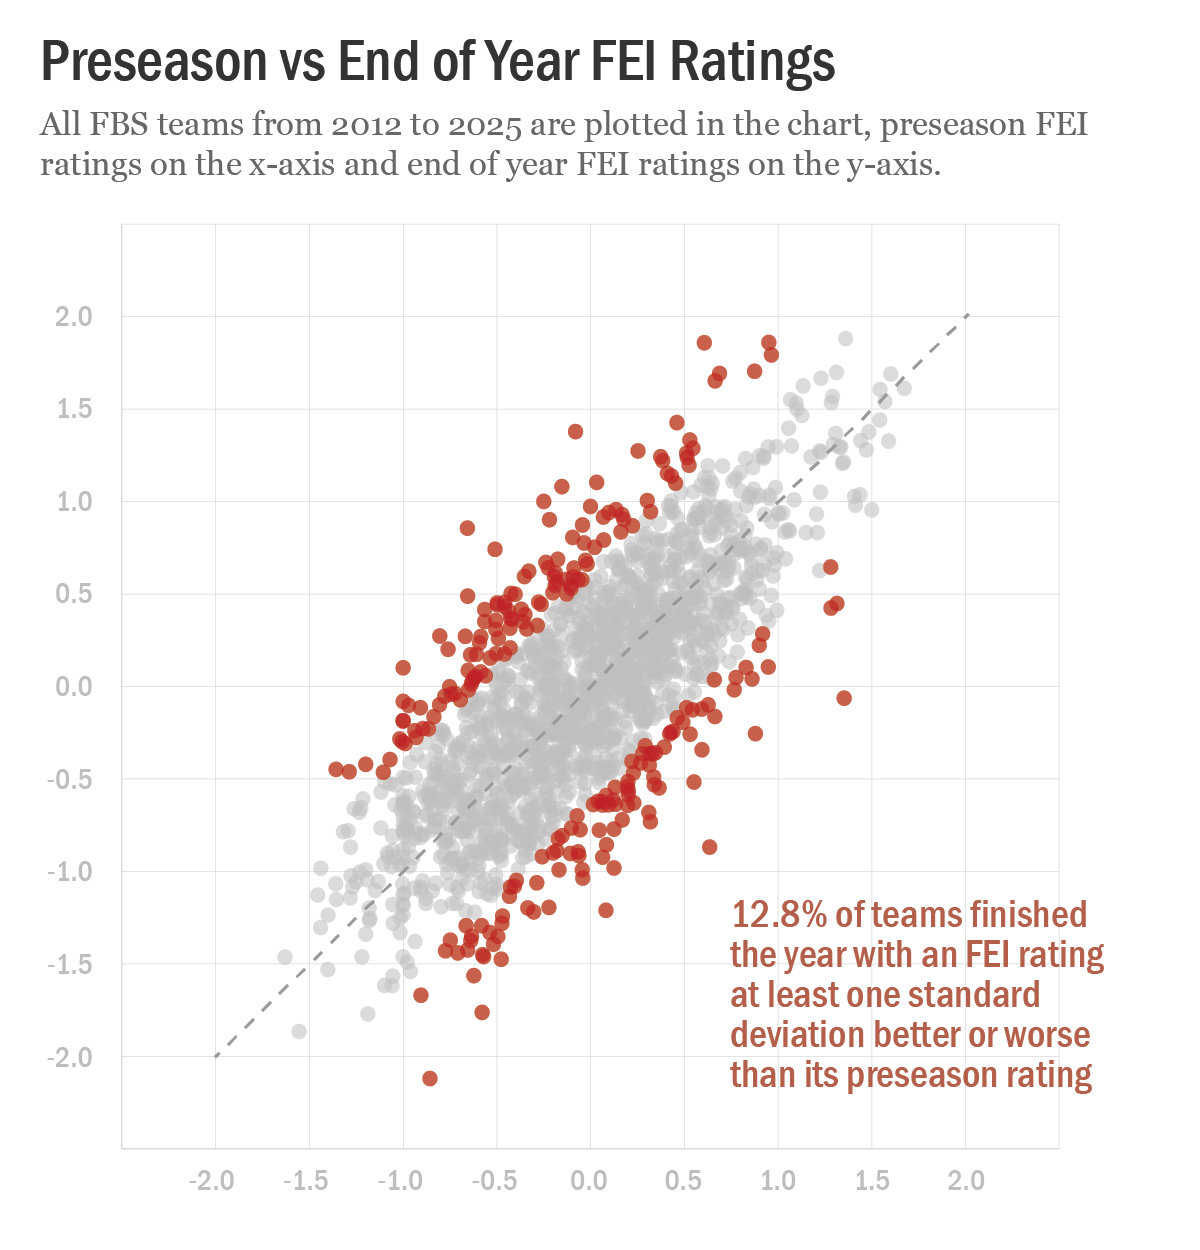
And what should we make of the outliers? Through one lens, the red dots in the first chart represent “errors” in the preseason formula. It’s tempting to think about them as something a better projection model with different inputs might fix or eliminate. I prefer to think about substantial deviations from reasonable baselines more as curiosities worth highlighting — something special either went very right or very wrong for these teams in those seasons.
Or perhaps there was something very strange about the season itself. College football had a “bad data” problem in 2020, with a wonky season of results disrupted by the global pandemic producing very unreliable opponent-adjusted FEI ratings due to the relative scarcity of non-conference games. There were 32 red dots in 2020 — that is, 32 out of 127 teams that season (25.2%) finished the year with an FEI rating at least one standard deviation better or worse than its preseason projection.
Ratings are normally distributed, and one standard deviation is approximately 0.6 on the FEI rating scale, calibrated to equate to a scoring advantage or disadvantage on a neutral field of 0.6 points per possession. In terms of the FEI ranking scale, and now with nearly 140 FBS teams: an average team should expect to rank in the mid-60s at season’s end, a good team one standard deviation better than average should appear in the mid-20s, and an elite team two standard deviations better than average will typically finish around 5th. National champions sometimes push into three-sigma (three standard deviations above average) territory.
Compare the high number of 2020 outliers to those in 2024 (23 red dots out of 134 FBS teams, 17.2%) and 2025 (15 red dots out of 136 FBS teams, 11.0%). If we exclude the 2020 season, there have been an average of 15.5 red dots per season over the entire span — 11.9% of teams (less than half of the 2020 rate) have been at least one-sigma projection outliers since 2012.
College football remains reliably stable year over year in the aggregate, but maybe the outlier results are getting more extreme than ever before? Perhaps you guessed that the defending national champion Indiana Hoosiers sit atop the table of “most positive outliers” on record:
Most Positive Outliers (excluding 2020) | ||||||
| Season | Team | PFEI | Rk | FEI | Rk | Delta |
| 2025 | Indiana | .61 | 15 | 1.86 | 1 | 1.25 |
| 2024 | Indiana | -.15 | 77 | 1.08 | 7 | 1.23 |
| 2023 | Arizona | -.22 | 82 | .90 | 14 | 1.12 |
| 2022 | James Madison | -1.00 | 126 | .10 | 60 | 1.10 |
| 2017 | Florida Atlantic | -.80 | 120 | .27 | 39 | 1.07 |
| 2025 | Vanderbilt | .03 | 64 | 1.10 | 9 | 1.07 |
| 2025 | Texas Tech | .25 | 41 | 1.27 | 6 | 1.02 |
| 2023 | Oregon | .69 | 12 | 1.69 | 1 | 1.00 |
| 2013 | Florida State | .66 | 15 | 1.65 | 1 | .99 |
| 2014 | Louisiana Tech | -.56 | 100 | .42 | 33 | .98 |