
sources
I’m asked from time to time about how I gather the data to produce FEI ratings and other metrics I publish on this site. I utilize several sources, but a reliable account of the results of every possession in every FBS game is sometimes a bit tricky to assemble.
Stanford defeated Hawaii 37-27 on Saturday, August 29th at Stanford Stadium. I did not watch this game live, nor did I catch a replay. My first look at the result came the following day when I started my weekly data collection and review process, beginning with Bill Radjewski’s terrific collegefootballdata.com site. Bill makes a wealth of data available and accessible via CSV exports, API keys, and many more tools, an extraordinary resource built for data beginners, enthusiasts, modelers, and everyone in between.
I’m really only interested in capturing a few key data points with every possession in every FBS game: who had the ball, where on the field did the possession begin, how many scrimmage plays were run on the possession, where did it end, how did it end, and what was the score when it ended. I also record whether the possession took place in the first half, second half, or in overtime. Here’s the core data from the first four possessions in the Stanford vs Hawaii game:
| Poss | Half | Possession | Start | Plays | Yards | End | Result | Score |
| 1 | 1 | Stanford | own-21 | 3 | 7 | own-28 | Punt | 0-0 |
| 2 | 1 | Hawaii | own-30 | 3 | 2 | own-32 | Punt | 0-0 |
| 3 | 1 | Stanford | own-11 | 9 | 89 | opp-0 | TD | 7-0 |
| 4 | 1 | Hawaii | own-25 | 3 | 1 | own-26 | Punt | 7-0 |
More specifically, this is my record of the first four possessions in the game, and it’s slightly different than what you might find if you look at other sources. Note the fourth possession overall in the game — Hawaii started an offensive drive on its own 25-yard line, went three-and-out, and punted from the 26-yard line, ho hum, nothing much to see here. But here’s how the same possession sequence appears in the game’s official box score drive chart:
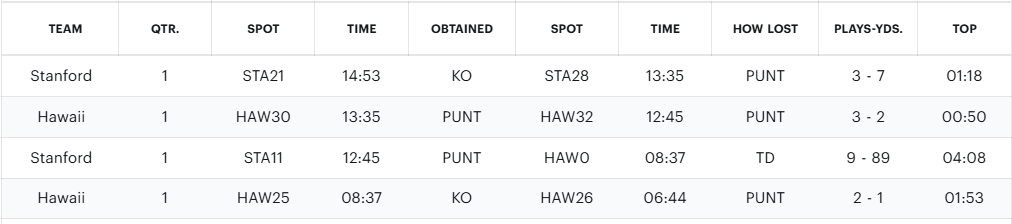
A snapshot of the drive chart table in Stanford’s August 29, 2026 victory over Hawaii.
The official record of the game is compiled by the home team’s statisticians live from the stadium press box, so I like to check those “sources of truth” when I’m pulling together my possession data set. According to Stanford’s game log, Hawaii gained one yard on only two plays — not three plays — on this series. As of this post, it’s also recorded as a drive of only two plays in Bill Radjewski’s data set and in the ESPN play-by-play account of the game, and probably everywhere else we might look that originates from the official game record.
Hold on, did Hawaii punt on third down? That would be very weird. Here’s the official play-by-play account (again, via Stanford’s source of truth) of the entire possession:
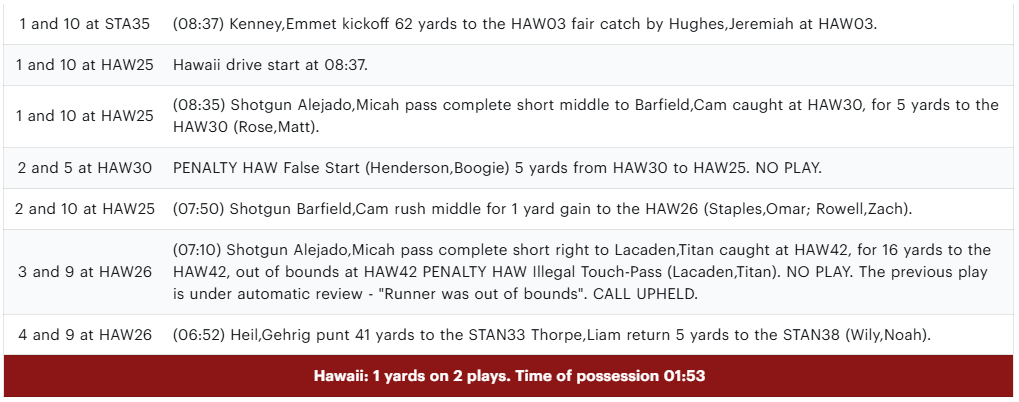
The play-by-play account of Hawaii’s second possession in its August 29, 2026 loss to Stanford.
No, the Warriors didn’t punt on second down. They threw a pass on 3rd-and-9 that would have been enough for a first down, but there was a penalty called and upheld on review for illegal touching by the receiver for stepping out of bounds prior to the catch. By rule, this is recorded as “NO PLAY” in the box score and third down just vanishes. Two plays (first and second down), no play on third down, and a punt on fourth down — a “two-and-out” in the official game log.
So why do I record it as three plays instead? In this instance, I’m making a deliberate choice to deviate from the official record in my data set with my eventual output in mind. Even though only two plays are valid in the official game log, I’m choosing to evaluate the outcome of this drive as if it were exactly the same as one that ends in a routine incompletion instead of the penalty. This was effectively the same as a three-and-out, and I want my data to register the third down failure rather than omit it. (Only my yards per play calculations are impacted by this decision, not the possession efficiency data on which FEI ratings are built).
In fact, some data sources that focus on play success rates instead of possession efficiency might record the entire sequence as a two-play, six-yard drive. Hawaii completed a five-yard pass on first-and-10, and after a false start penalty backed things up, they ran the ball for one more yard on second-and-10. They gained six yards on offensive plays from scrimmage, but only advanced the ball one yard on the offensive drive. My method absorbs the penalty as part of Hawaii’s offensive performance on the series. Again, I’m making a deliberate data choice.
Consider also the sequence of possessions that ended the game. Stanford allowed Hawaii to rally in the fourth quarter, then answered with a touchdown to take back the lead, 30-27 with 1:41 remaining in the game.
| Poss | Half | Possession | Start | Plays | Yards | End | Result | Score |
| 25 | 2 | Stanford | own-38 | 7 | 62 | opp-0 | TD | 30-27 |
| 26 | 2 | Hawaii | own-25 | 4 | 6 | own-31 | Fumble | 30-27 |
| 27 | 2 | Stanford | - | - | - | - | TD | 37-27 |
| 28 | 2 | Hawaii | own-25 | 3 | 9 | own-34 | Half | 7-0 |
On the ensuing drive, Hawaii coughed up a fumble, and Stanford scooped it up and ran it into the end zone for a defensive touchdown to seal the victory. This wasn’t an offensive drive, so it doesn’t appear in drive summary accounts of the game. But I fill the gap in my possession log, and I utilize the scoring value generated and lost in non-offensive possessions like these in my offense, defense, and special teams unit ratings.
There are certainly some blind spots in my methodology, particularly with special teams plays that disappear into offensive and defensive drives. If a team runs a successful fake punt to extend a drive and advance the chains, my data set will never know about it — instead, it only appears as a single continuous drive. Similarly, a fourth down failure on a fake field goal attempt or disastrous long snap often dings the offense, not the punt team, because the data source doesn’t always make the distinction. Sure enough, our game in question featured a Hawaii punt blocked by the Cardinal, resulting in a safety and a 16-7 Stanford lead to start the second half.
One other box score anomaly in this particular game caught my attention on my first pass through the possession data. Midway through the third quarter, Stanford drove into Hawaii territory before stalling out, then punted into the Hawaii end zone for a touchback. Hold on, Stanford punted from the opponent 26-yard line?! I checked three sources including the official box score, and all of them had the same account on Sunday. I was so excited about the extraordinary rarity of a 26-yard line punt, I rushed to post about it on Bluesky and X/Twitter…

A snapshot of an erroneous (alas) net six-yard punt.