
drive plotting
I’ve been working on better ways to visualize college football game data for as long as I’ve been collecting it. This is the start of what I hope/expect will be a series of whiteboard posts about the development and refinement of new game and possession data visualization standards.
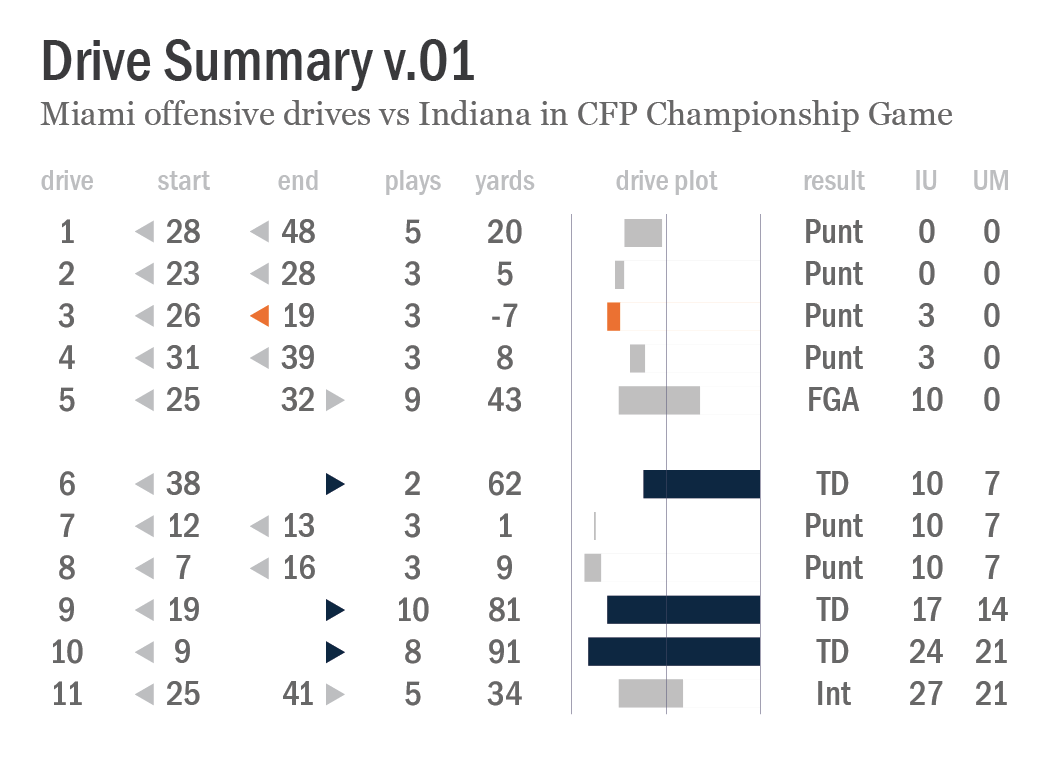
Chart titled “Drive Summary v.01”, an illustrated data table representing Miami’s 11 offensive drives against Indiana in the CFP Championship on January 19, 2026. Each row includes the drive number, starting and ending field position, plays, yards, drive result, and the game score at the conclusion of the drive, plus a graphic representation of the "drive plot".