
connecting dots
Possessions per game have steadily declined since 2015, points per game reached a 15-year low in 2025, plays per game have held steady over the last three seasons, points per possession appear to be leveling off, and plays per possession jumped to a 19-year high...
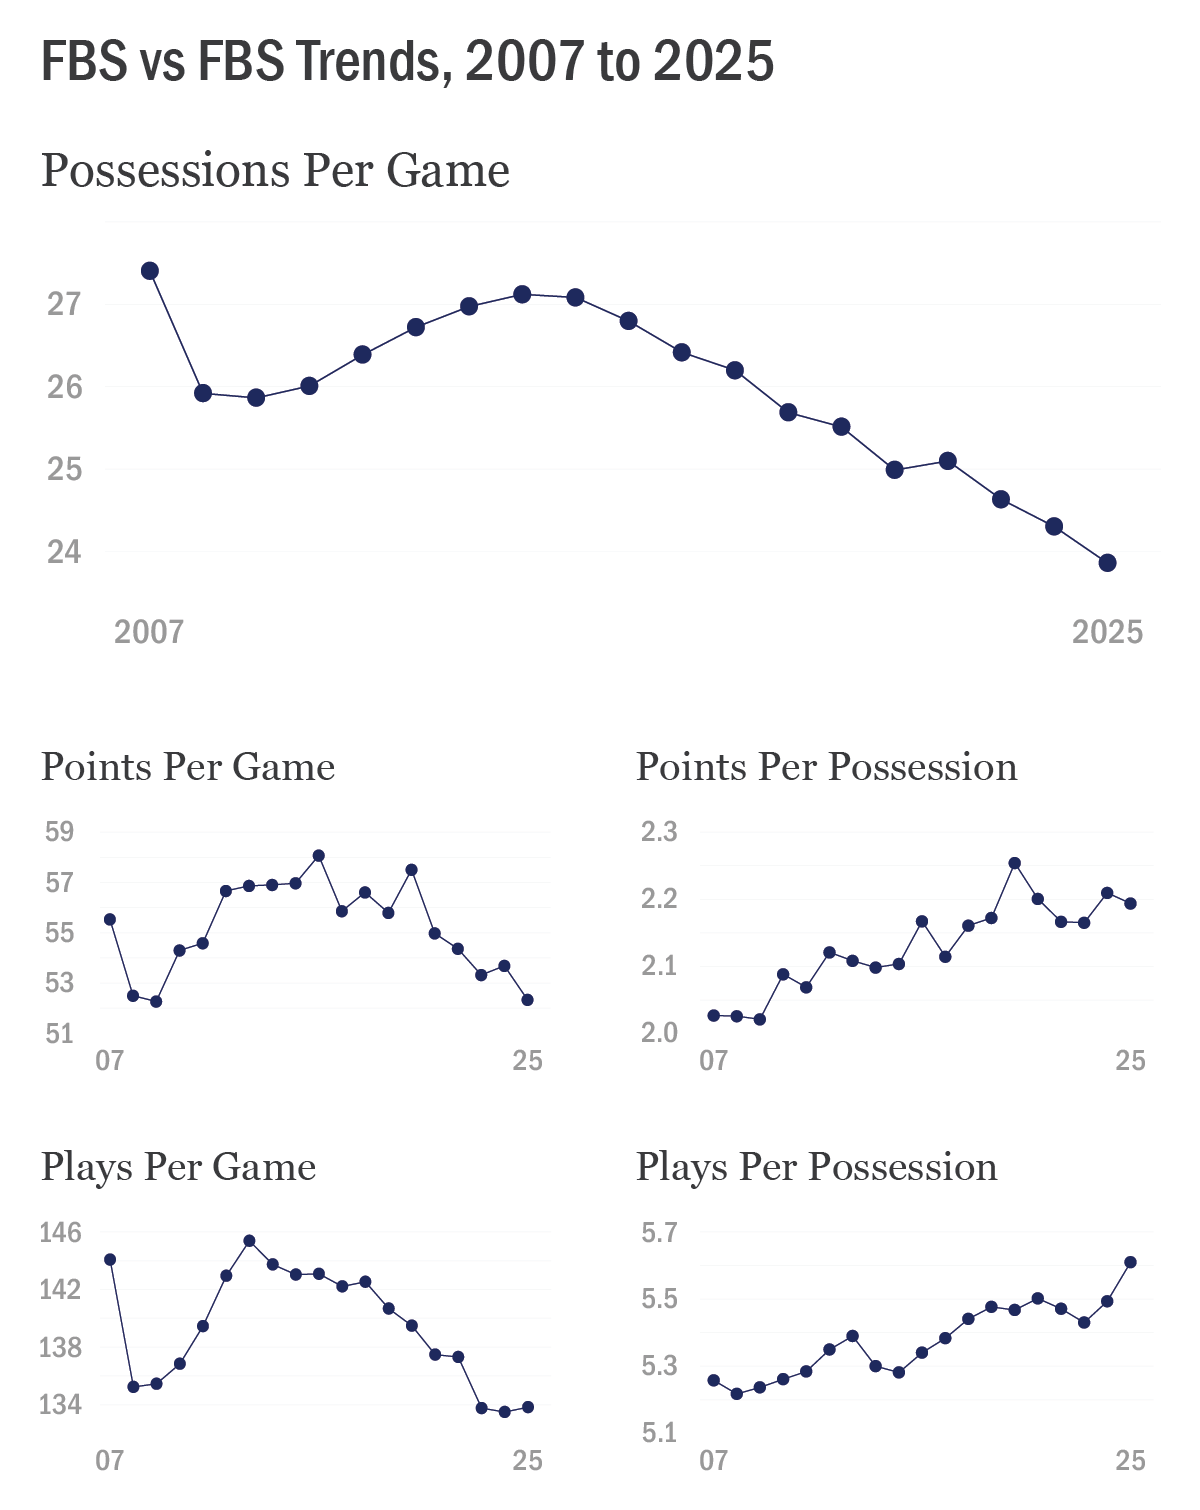
Chart series titled "FBS vs FBS Trends, 2007 to 2025" with line charts illustrating trends in Possessions Per Game, Points Per Game, Points Per Possession, Plays Per Game, and Plays Per Possession (see data table below)
One benefit of maintaining a large data set comprised of the same parameters over a period of time is the opportunity to take a step back and make note of trends. I examined the distribution of game possessions over time in a previous post, but the simple line chart above illustrating average (mean) possessions per game by season highlights an even more striking trendline. Since 2015, possessions per game have been declining at a nearly linear rate each year.
What do we make of this trend? The most frequent reaction I receive when I share this data on social media revolves around clock rule changes that appear (to some) to have taken football away and replaced it with more commercial breaks. I’m not particularly interested in exploring broadcast data myself, though I appreciate that others do. I know that clock rule changes (in 2008 and 2023, specifically) have had an impact on possession counts, but I’m struck by the near-linear decline over the last decade which indicates some additional factors are involved. There isn’t one thing that we can isolate as the reason for a steady decline in FBS possessions per game, it has to be a number of things in combination.
No-huddle, up-tempo offenses were very much in vogue in the mid-2010s, but have fallen out of favor since peaking in 2014-15 or so. Coach-to-player (C2P) helmet communications were introduced in 2024, and a new common cadence of offense pre-snap operational pace may be a by-product. Analytic tools have led coaches to adopt more aggressive decisions in 4th down situations. And as recently explored by my friend Parker Fleming, offenses and defenses are cyclically adjusting and adopting new strategies on how best to attack and defend to tilt game states in their favor. Trading explosive plays for methodical drives inevitably leads to changes (intentionally or otherwise) in the length and number of game possessions.
I like that this chart series positions the smooth possessions per game trendline in comparison to other less linear trends. Fewer possessions per game doesn’t exactly mean less football, it means different football. Scoring rates changing over time means something is probably happening with offenses and with defenses. College football is a complex game and it keeps changing in large and small ways. I’ve made versions of these charts before, but I don’t know that I ever would have accurately predicted where the trendlines would go next.
FBS vs FBS Data Trends | |||||
| Season | Poss/Game | Pts/Game | Plays/Game | Plays/Poss | Pts/Poss |
| 2007 | 27.4 | 55.5 | 144.1 | 5.26 | 2.03 |
| 2008 | 25.9 | 52.5 | 135.2 | 5.22 | 2.03 |
| 2009 | 25.9 | 52.3 | 135.5 | 5.24 | 2.02 |
| 2010 | 26.0 | 54.3 | 136.8 | 5.26 | 2.09 |
| 2011 | 26.4 | 54.6 | 139.5 | 5.28 | 2.07 |
| 2012 | 26.7 | 56.7 | 143.0 | 5.35 | 2.12 |
| 2013 | 27.0 | 56.9 | 145.4 | 5.39 | 2.11 |
| 2014 | 27.1 | 56.9 | 143.7 | 5.30 | 2.10 |
| 2015 | 27.1 | 57.0 | 143.0 | 5.28 | 2.10 |
| 2016 | 26.8 | 58.1 | 143.1 | 5.34 | 2.17 |
| 2017 | 26.4 | 55.9 | 142.2 | 5.38 | 2.11 |
| 2018 | 26.2 | 56.6 | 142.5 | 5.44 | 2.16 |
| 2019 | 25.7 | 55.8 | 140.7 | 5.48 | 2.17 |
| 2020 | 25.5 | 57.5 | 139.5 | 5.47 | 2.25 |
| 2021 | 25.0 | 55.0 | 137.5 | 5.50 | 2.20 |
| 2022 | 25.1 | 54.4 | 137.3 | 5.47 | 2.17 |
| 2023 | 24.6 | 53.3 | 133.8 | 5.43 | 2.17 |
| 2024 | 24.3 | 53.7 | 133.5 | 5.49 | 2.21 |
| 2025 | 23.9 | 52.3 | 133.8 | 5.61 | 2.19 |